Financial advisors in Troy NY
Helping you prepare
for your financial future
We're a team of investment advisers committed to protecting the financial future of our clients.

We're a team of investment advisers committed to protecting the financial future of our clients.

With Halloween just around the corner, it may be hard to believe but it’s time to start looking at end of year planning. In lieu of a traditional chart this week, we thought it would be a good idea to remind everyone of some year-end “tricks” that could lead to some “treats” down the road! In actuality, there are no tricks here just good sound financial planning tips as the year winds down, many of which we are actively working on for and with clients as we type this.
Top 10 Financial Planning Tips for Year-End
As noted above, many of these year-end tasks such as RMDs and Rebalancing are well underway in our office, and you may have seen the related activity in your accounts. If you have any questions about any of the above or wonder if you are a candidate, don’t be “scared” to give us a call to discuss!
“This presentation is not an offer or solicitation to buy or sell securities. The information contained in this presentation has been compiled from third party sources and is believed to be reliable, but its accuracy is not guaranteed and should not be relied upon in any way, whatsoever. Fagan portfolio characteristics and holdings are subject to change at any time and are based on a representative portfolio. Holdings and portfolio characteristics of individual client portfolios may differ, sometimes significantly, from those shown. This information does not constitute, and should not be construed as, investment advice or recommendations with respect to the securities listed.
Additional information including management fees and expenses is provided on our Form ADV Part 2. The actual return and value of an account fluctuate and, at any time, the account may be worth more or less than the amount invested. Bond Investments are affected by interest rate changes and the credit-worthiness of the issues held in the portfolio. A rise in interest rates will cause a decrease in the value of fixed income positions. Past performance results are not indicative of future results.”
As we sit near all time highs in the stock market, talking diversification and broadening out your portfolio can be hard to implement. Why sell the holdings that have treated you so well?
However, as you can see by the chart below, provided by YCharts, from the end of 1999 through 2007, a $10,000 investment in the S&P 500 grew to just $11,409, including reinvested dividends. Meanwhile, emerging markets reached $31,260, small-cap value climbed to $25,830, and mid-cap value rose to $25,120. Developed international stocks also finished ahead of the S&P 500. Overconcentration in a particular index or sector could be detrimental to your portfolio, especially when factoring in distributions as well as the possibility of a poor sequence of returns.
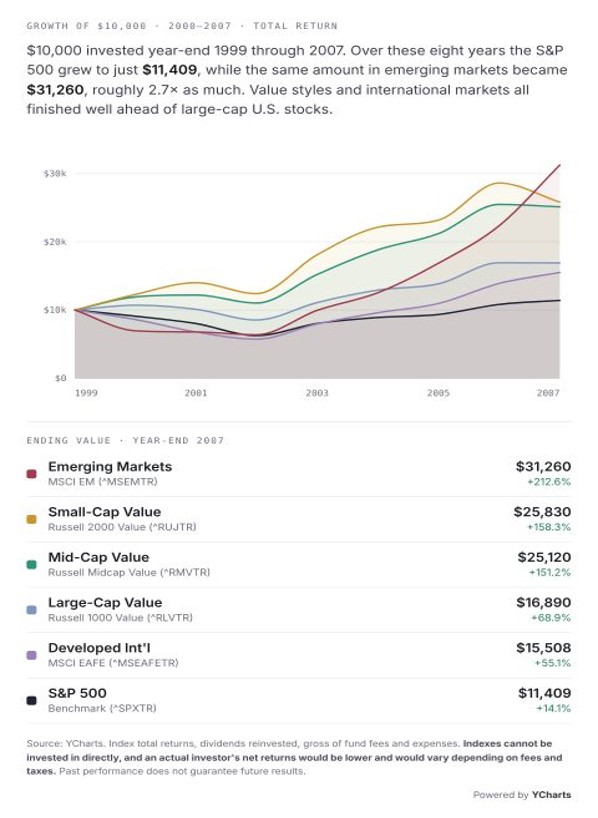
Currently, we are in a period of concentration we have never seen before. According to The Compound, the top 5 S&P 500 stocks (NVDA, AAPL, GOOGL, MSFT, AMZN) are now equal in market cap to the bottom 434 stocks as Doug mentioned on the radio show last Sunday. This has worked out well for those of us who have been invested in these companies. Going forward, diversification may not be the most profitable thing to do, but t is the right thing to do. When you are at or near retirement, you give up performance for stability, and that is what diversification does. Combining diversified equities with appropriate bonds and cash reserves can help reduce pressure to sell stocks during difficult markets and gives you flexibility when distributing assets.
“This presentation is not an offer or solicitation to buy or sell securities. The information contained in this presentation has been compiled from third party sources and is believed to be reliable, but its accuracy is not guaranteed and should not be relied upon in any way, whatsoever. Fagan portfolio characteristics and holdings are subject to change at any time and are based on a representative portfolio. Holdings and portfolio characteristics of individual client portfolios may differ, sometimes significantly, from those shown. This information does not constitute, and should not be construed as, investment advice or recommendations with respect to the securities listed.
Additional information including management fees and expenses is provided on our Form ADV Part 2. The actual return and value of an account fluctuate and, at any time, the account may be worth more or less than the amount invested. Bond Investments are affected by interest rate changes and the credit-worthiness of the issues held in the portfolio. A rise in interest rates will cause a decrease in the value of fixed income positions. Past performance results are not indicative of future results.”

On the radio show and in this space as well we’ve talked about how September is traditionally the absolute worst-performing calendar month for the S&P 500. Since 1928, the average September loss for the S&P is 1.13%. While September 2026 was slightly better than that trend (the S&P was down 0.5%), as the chart below powered by YCharts illustrates – 10 of the 11 sectors covered by State Street Select’s Sector SPDR ETF’s were in negative territory. The very strong outlier? Technology.
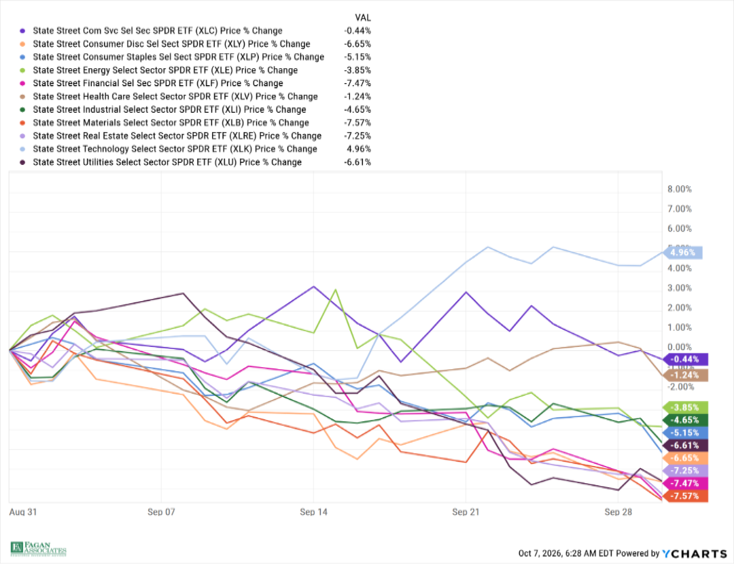
The technology sector’s dramatic outperformance becomes even more striking when contrasted against the S&P 500 index. During this late-summer stretch, a traditional cap-weighted benchmark would have felt immense downward gravity. Because ten out of eleven market sectors finished in the red—with major pillars like Materials, Financials, and Real Estate plunging over 7%—most the index's underlying constituents were in a steep correction. In a typical market cycle, such widespread bleeding drags the entire benchmark down into a deep, synchronized retreat.
However, because the modern S&P 500 is heavily top weighted by mega-cap technology and communication design companies, the 4.96% surge in the XLK Technology ETF acted as an incredibly powerful counterweight. This stark divergence illustrates a "two-speed market." On one path, the equal-weighted reality of the average stock was suffering under the weight of macroeconomic pressures, dragging down cyclical and defensive sectors alike. On the other path, a highly concentrated cluster of secular growth engines defied that gravity entirely. For investors benchmarked against the S&P 500, portfolio returns during this window were entirely dictated by their exposure to this single, resilient tech channel.
“This presentation is not an offer or solicitation to buy or sell securities. The information contained in this presentation has been compiled from third party sources and is believed to be reliable, but its accuracy is not guaranteed and should not be relied upon in any way, whatsoever. Fagan portfolio characteristics and holdings are subject to change at any time and are based on a representative portfolio. Holdings and portfolio characteristics of individual client portfolios may differ, sometimes significantly, from those shown. This information does not constitute, and should not be construed as, investment advice or recommendations with respect to the securities listed.
Additional information including management fees and expenses is provided on our Form ADV Part 2. The actual return and value of an account fluctuate and, at any time, the account may be worth more or less than the amount invested. Bond Investments are affected by interest rate changes and the credit-worthiness of the issues held in the portfolio. A rise in interest rates will cause a decrease in the value of fixed income positions. Past performance results are not indicative of future results.”


