
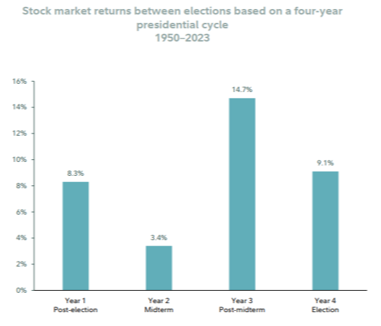
History suggests that stock market performance has varied meaningfully across the four-year presidential cycle. As the chart below, provided by Fidelity Investments, illustrates, the second year of a presidency (midterm year) has historically produced the weakest average return at 3.4%. Midterm years often bring heightened uncertainty as investors assess potential changes – and if we know anything about the stock market, we know that it does not like uncertainty.
Sources: US BUREAU OF LABOR STATISTICS
However, the period following the midterm election has historically been much stronger. Year three of the presidential cycle has generated an average return of 14.7%, the highest of the four years shown. One possible explanation is that election-related uncertainty begins to fade, while elected officials may focus on policies intended to support economic growth ahead of the next presidential election. Historically, it really doesn’t matter how the midterm election goes - Democratic sweep, Republican sweep, split Congress. Regardless of the outcome, the following year the S&P 500 returns, on average, anywhere between 10% and 15% and is positive roughly 88% of the time according to Sofi.The broader lesson is not that investors should attempt to time the market around elections. Although historical patterns can provide useful context, each market cycle is shaped by different economic conditions, including inflation, interest rates, corporate earnings, and geopolitical events.
“This presentation is not an offer or solicitation to buy or sell securities. The information contained in this presentation has been compiled from third party sources and is believed to be reliable, but its accuracy is not guaranteed and should not be relied upon in any way, whatsoever. Fagan portfolio characteristics and holdings are subject to change at any time and are based on a representative portfolio. Holdings and portfolio characteristics of individual client portfolios may differ, sometimes significantly, from those shown. This information does not constitute, and should not be construed as, investment advice or recommendations with respect to the securities listed.
Additional information including management fees and expenses is provided on our Form ADV Part 2. The actual return and value of an account fluctuate and, at any time, the account may be worth more or less than the amount invested. Bond Investments are affected by interest rate changes and the credit-worthiness of the issues held in the portfolio. A rise in interest rates will cause a decrease in the value of fixed income positions. Past performance results are not indicative of future results.”


