
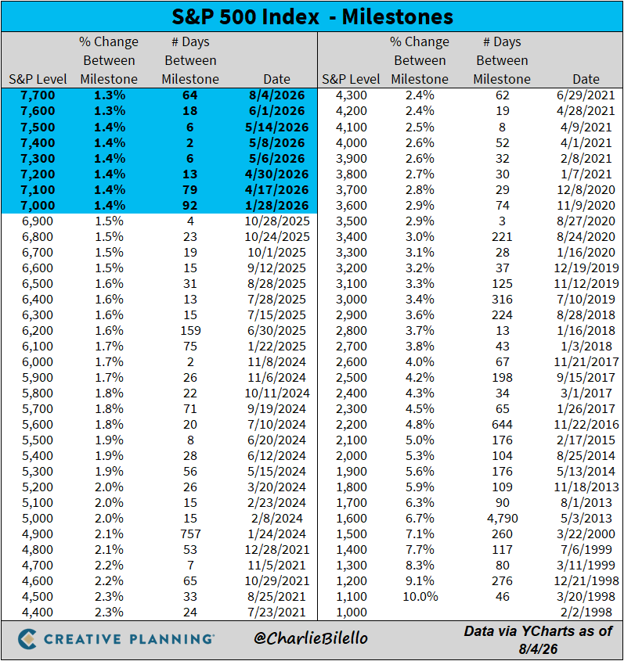
Yesterday, the S&P 500 reached a new all-time closing high of 7,736.52, marking its first close above the 7,700 threshold. This week’s rally has been fueled by strong corporate earnings, a sharp rebound in artificial intelligence stocks, and easing oil prices. The chart below, from Charlie Biello of Creative Planning, shows the S&P 500’s historical high-water marks in 100-point increments, dating back to its first move above 1,000 in February 1998.
Record highs can often act as a catalyst as some sort of psychological breakout. Crossing milestones can shift investor psychology from risk aversion to fear of missing out. Consistent all-time highs typically coincide with strong economic cycles, robust corporate cash flows, or revolutionary technological expansions. That environment is prevalent in many ways today.
Notably on the chart is the record drought from Marcy 2000 through May 2013, when it took the S&P 500 4,790 days to break thru the 1,600-point barrier. That period was the double whammy of the Dot Com bubble bursting and a global financial crisis. The next longest drought was 757 days December 2021 through January 2024.
All in all, the S&P has been in a prolonged bullish cycle since eclipsing 4,900 in January 2024. Given all the major catalysts currently – the AI investment boom, corporate earnings resilience, and macroeconomic tailwinds – we see now reason we won’t see some more 100-point level breakthroughs soon. Will we crest 8,000 in 2026? Something to watch between now and the end of the year.
“This presentation is not an offer or solicitation to buy or sell securities. The information contained in this presentation has been compiled from third party sources and is believed to be reliable, but its accuracy is not guaranteed and should not be relied upon in any way, whatsoever. Fagan portfolio characteristics and holdings are subject to change at any time and are based on a representative portfolio. Holdings and portfolio characteristics of individual client portfolios may differ, sometimes significantly, from those shown. This information does not constitute, and should not be construed as, investment advice or recommendations with respect to the securities listed.
Additional information including management fees and expenses is provided on our Form ADV Part 2. The actual return and value of an account fluctuate and, at any time, the account may be worth more or less than the amount invested. Bond Investments are affected by interest rate changes and the credit-worthiness of the issues held in the portfolio. A rise in interest rates will cause a decrease in the value of fixed income positions. Past performance results are not indicative of future results.”


