Last Wednesday, the Federal Open Market Committee (FOMC) voted unanimously to raise the benchmark interest rate a quarter of a percentage point, the first rate hike in over three years (July 2023). The forward-looking guidance suggested that a further increase in 2026 is likely. Historically speaking, how does a rate hiking cycle impact the stock market? As the chart below from Charlie Bilello with Creative Planning illustrates, the answer might surprise you.
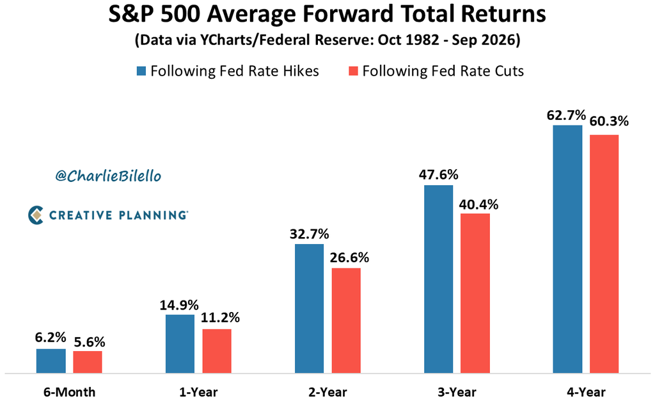
The chart breaks down the S&P 500 average forward total returns dating back to 1982, analyzing 5 distinct time horizons after two contrasting policy environments: rate hikes (blue) and rate cuts (red). The key takeaway obviously being that historically speaking, S&P 500 returns are higher following rate hikes than rate cuts across every measured time frame.
This counterintuitive trend stems from the underlying economic context of Fed policy. The central bank typically raises interest rates to cool down a strong, expanding economy that is experiencing high inflation. During these tightening cycles, robust corporate earnings and economic momentum often override the headwinds of higher borrowing cost, driving steady long-term equity growth.
Conversely, the Fed generally cuts interest rates as an emergency response to an economic slowdown, recession, or market crisis. While lower rates are designed to stimulate growth, the early stages of a rate-cutting cycle often overlap with declining corporate profitability and broader economic pain, resulting in slightly lower average returns compared to expansionary hiking periods.
Ultimately, the data highlights that the long-term trajectory of the stock market is determined more by fundamental economic health than the direction of interest rates alone.
“This presentation is not an offer or solicitation to buy or sell securities. The information contained in this presentation has been compiled from third party sources and is believed to be reliable, but its accuracy is not guaranteed and should not be relied upon in any way, whatsoever. Fagan portfolio characteristics and holdings are subject to change at any time and are based on a representative portfolio. Holdings and portfolio characteristics of individual client portfolios may differ, sometimes significantly, from those shown. This information does not constitute, and should not be construed as, investment advice or recommendations with respect to the securities listed.
Additional information including management fees and expenses is provided on our Form ADV Part 2. The actual return and value of an account fluctuate and, at any time, the account may be worth more or less than the amount invested. Bond Investments are affected by interest rate changes and the credit-worthiness of the issues held in the portfolio. A rise in interest rates will cause a decrease in the value of fixed income positions. Past performance results are not indicative of future results.”